
Simplexity Setups
The Simplexity Setups page is a members only report published weekly*, usually on Saturdays. It covers over 35 commodity and financial markets.
* Some weeks may not be published due to holidays.
Below is a copy of the Simplexity Setups page as it appeared on June 10, 2023. Notes in blue text are not part of the report but are included here to describe how the report works.
_________________________________________________________________________________________________
Simplexity - June 2023 Seasonal Video
Prior to the next calendar month, the seasonal video for that month is posted here
_________________________________________________________________________________________________
Simplexity SimTrend Setups
The grain markets haven't changed much since last week.
BO rallied most of the week as we predicted but we were unable to find an entry into the market.
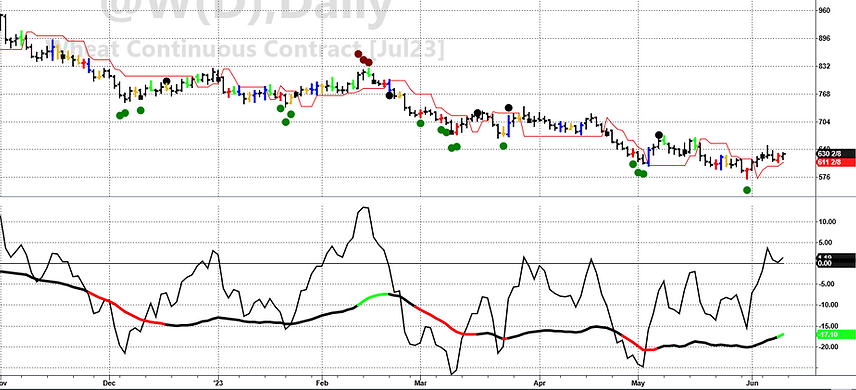
W (below) is toying around with a rally but has a lot of seasonal weakness coming up right now. It really bounced off of our exhaustion signal nicely. Now, we need to wait and see if this seasonal weakness can cause a dip in price while ST is still heading up. If this occurs, that will be our entry long into the wheat market.
S needs a pullback from this rally in order to buy.
SM is still bottoming out

MEATS
LC (below) is coming off a very strong rally followed by hitting some exhaustion signals. This pullback has created a TG signal in ST. We will be buyers at Friday's high on Monday.


SOFTS
CT (below) has a TT signal. ST is black while trending up. Coupled with the down range/down close bar on Friday means we will buy Friday's high on Monday.
If SB can rally a little more, it will present a short opportunity very soon.


ENERGIES
HO (below) is set up with a bullish TT formation. We just hate the exorbitant cost of margin for HO and will not be taking this trade. But, the trade is there nonetheless.
CL looks to be setting up bullish but it's too soon still.


METALS
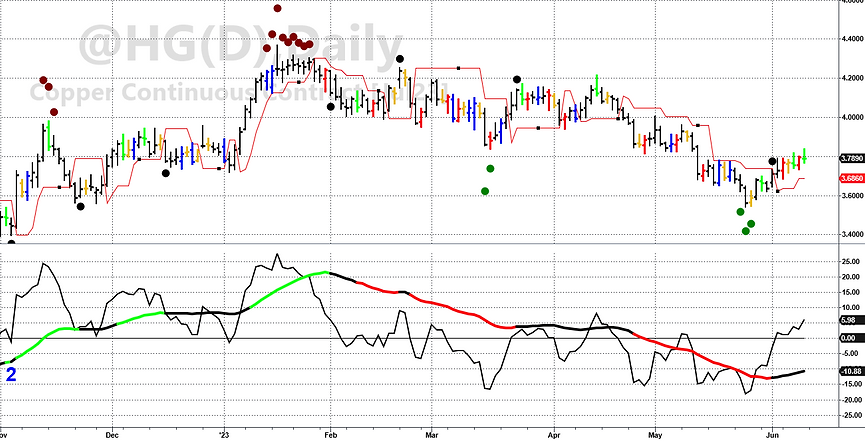
We warned last week that HG (below) came off of it's exhaustion signal and rallied into a TT formation. We are now long this market.

FINANCIALS
US (below). If price breaks below Friday's low on Monday, we will take the short trade there.


STOCKS
We don't see any current trade setups in the equity markets. Frankly, we're quite surprised with this latest big rally. ES (below) is now back to its level from almost one year ago.


CURRENCIES
Not much to speak of with the currencies. Only DX (below) has a long TG signal and NE1 has a short ST black signal. The DX entry on this pattern is to be a buyer at Thursday's high. That price is a long way away and very doubtful that DX gets there on Monday. Even if it does, moving so far to an entry isn't optimal.

_________________________________________________________________________________________________
Simplexity Seasonals
This button takes you to a page describing how our Simplexity Seasonals work.
ES: $2,000 stop
GC: $2,000 stop
US: $2,000 stop
W: $1,300 stop

LH: $1,200 stop
SB: $1,000 stop

_________________________________________________________________________________________________
Simplexity Premiums
This button takes you to a page describing how our Simplexity Premiums work.
Markets in a premium:
C
S
SM
BO
LH
CC
CT
KC
SB
_________________________________________________________________________________________________
Simplexity 5 Day Holds
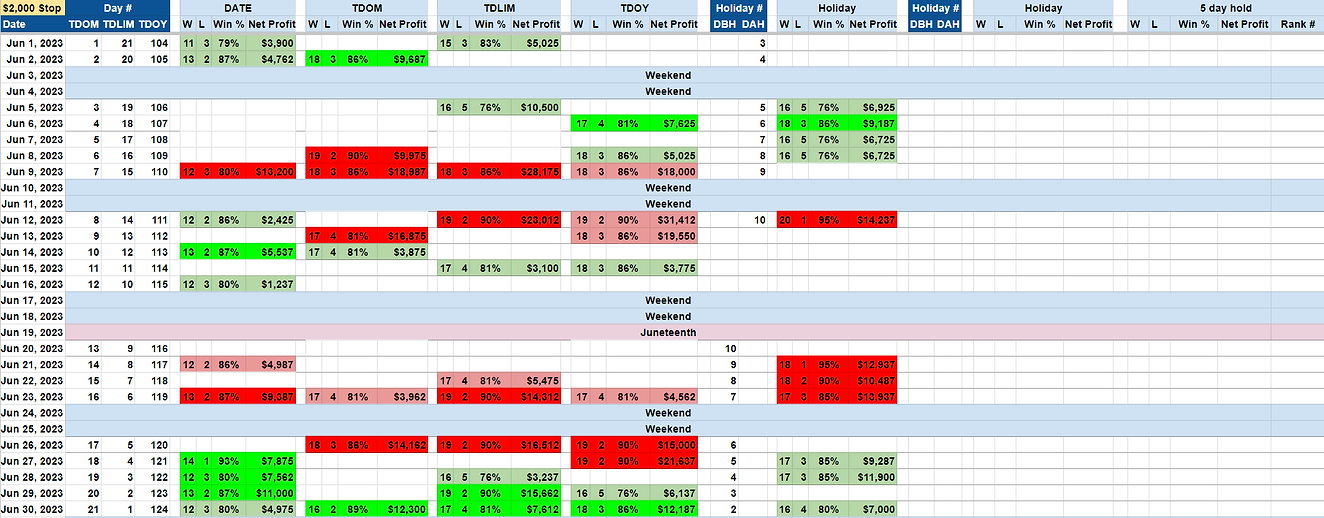
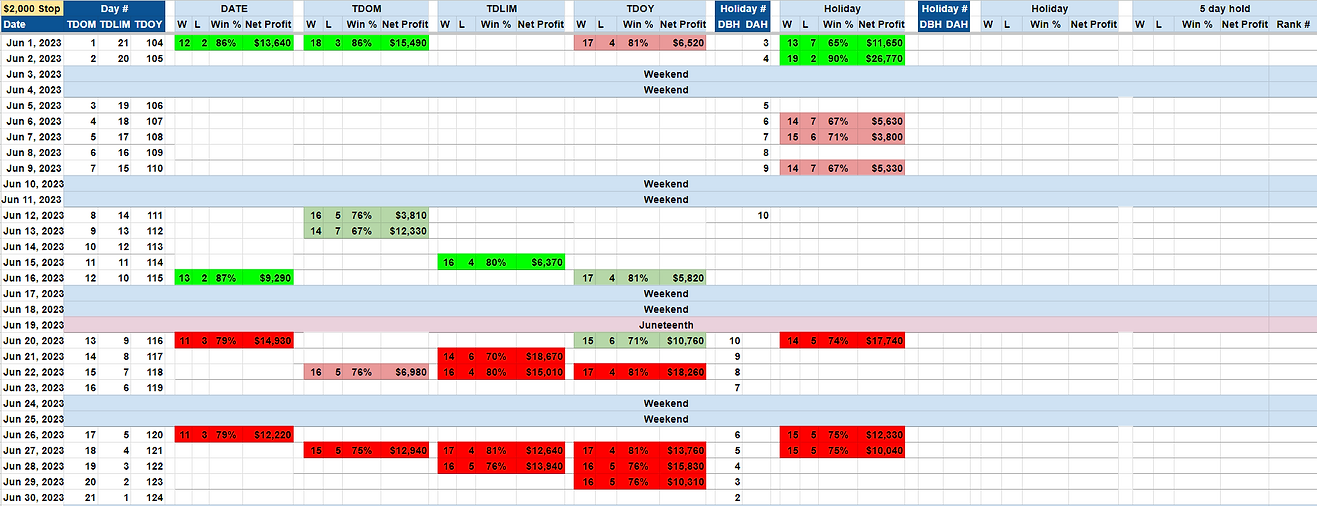
The Simplexity 5 Day Hold highlights certain times of the year that has exceptional bullishness. Using the Trading Day of the Year (TDOY), we assess seasonal areas of at least 5 days of sustained bullishness. 5 Day Holds will appear on the calendars above if there are any for that particular market for that month. Markets without a calendar above that have 5 Day Holds will be listed here.
*****NEW***** We have added a rank column. We will list the top five 5-day holds based on winning % and net profit for the year. For example, if you see a day ranked as 1st, that means it is the best 5-day hold for the year. 5th would be the 5th best 5-day hold of the year. These are geared towards highlighting the absolute most bullish of the bullish times of the year historically.
Market
NG
TY
MP1
Date
Jun. 13
Jun. 15
Jun. 14
W
16
18
19
L
5
3
2
Win %
76%
86%
90%
Net
Profit
$21,120
$9,921
$4,615
Stop
$2,000
$1,300
$1,000
Rank #
1st
3rd
_________________________________________________________________________________________________
Simplexity Seasonal Week of the Year
Week #24
Simplexity Seasonal Week of the Year. Listed are any markets that have a top 10 most bullish or bearish week of the year.
The seasonal week of the year is based on buying the open on Monday and selling the close on Friday of each trading week. Based on the cumulative average ranking of winning % and net profits. Winning % is weighted 2:1 against net profits to smooth out any anomalies due to extreme years. Listed are any markets that have a top 10 bullish or bearish reading for the year.
e.g. If you see GC - 5 listed under the bullish column, that means the week ahead is the 5th most bullish week of the year historically for GC.
Bullish:
NG - 4
BP - 9
Bearish:
S - 6
SM - 8
BO - 2
W - 4
CT - 5
KC - 1
RB - 8
PL - 6
_________________________________________________________________________________________________
Simplexity Seasonal Month of the Year
June
Simplexity Seasonal Month of the Year. Listed are any markets that have a top 3 most bullish or bearish month of the year.
The seasonal month of the year is based on buying the open on the first trading day of the month and selling the close on the last trading day of the month. Rankings are based on the cumulative average ranking of winning % and net profits. Net profits is weighted 2:1 against winning % to smooth out any anomalies due to extreme years. Listed are any markets that have a top 3 bullish or bearish reading for the year.
e.g. If you see GC - 3 listed under the bullish column, that means the month ahead is the 3rd most bullish month of the year historically for GC.
Bullish:
LC - 2
CC - 3
SB - 1
CL - 3
SF - 2
Bearish:
BO - 3
W - 1
LH - 1
CT - 2
GC - 3
PL - 2
SI - 3
ES - 3
YM - 3