ADX
The ADX indicator stands for average directional movement index. It was developed by Welles Wilder and first published in his book New Concepts in Technical Trading Systems in 1978. ADX comes pre-installed on many trading websites and platforms. It has stood the test of time as it remains one of the most popular trading tools in the world today.
What is ADX?
ADX measures the overall strength of a trend of a market. However, it does not indicate the direction of the strength of the trend. This is why ADX often comes with two sub indicators, DMI+ and DMI-.
DMI+ is the positive directional index. It measures the strength of positive price moves.
DMI- is the negative directional index. It measures the strength of negative price moves.
Therefore, ADX measures the average of the difference between DMI+ and DMI-.
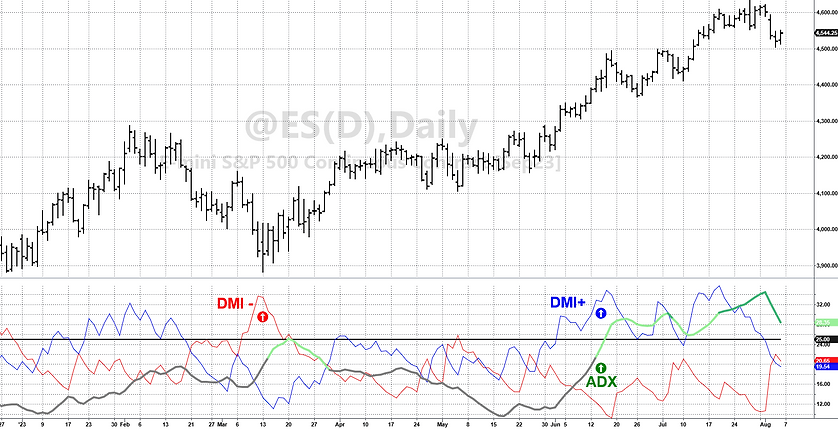
By looking at DMI+/DMI- we are able to determine if ADX is measuring the strength of an up trend or a down trend by looking at which DMI is above the other. When DMI+ is greater than DMI-, the bulls are said to be in control of the market and the trend is bullish. Conversely, when DMI- is greater than DMI+, the bears are in charge and the trend is down.
Lastly, ADX measures an average over a certain period of time. By default, ADX is usually set to a look back period of 14. Using a smaller look back would create a line with many more fluctuations. A larger look back would create a very smooth line and take longer for trading signals to develop.
ADX with DMI on a chart

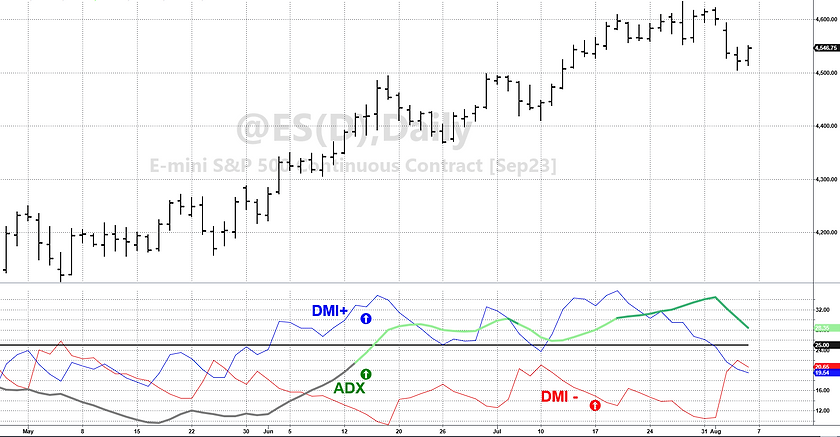
The above chart is Simplexity Analytics customized ADX indicator. The ADX line is the thicker gray line that turns darker shades of green as it gets stronger. The DMI+ line is the thinner blue line and the DMI- line is the thinner red line.
Interpreting the chart

The other line on our indicator is the horizontal black line with a value of 25 on the right column. ADX crossing over 25 is widely considered to be the threshold that ADX needs to cross in order to be considered a strong trend.
Our ADX line remains gray under 20. Once ADX is greater than 20, it turns green. We have it turn green at 20 instead of 25 just to provide an early indication that ADX is approaching a key level.
Example of a complete ADX trend

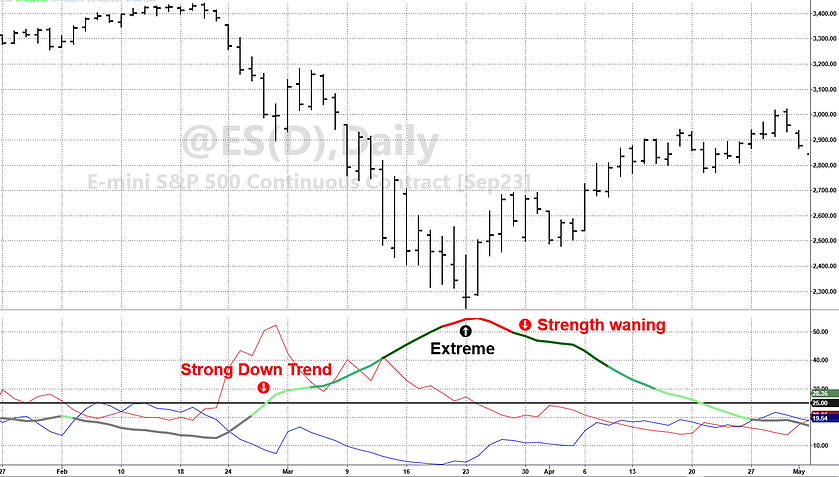
In the chart above, we see on Feb. 20 that DMI- crossed over DMI+. This is the very first alert that the bears are taking over the market. One week later, ADX crosses 20 and turns green and then also crosses the 25 threshold. This signals the beginning of a possible strong down trend. Next, we have ADX turn a darker shade of green when it crosses over 30 and then an even darker green when it crosses over 40. There is no technical reason for this, it is merely a visual aid to help see the ADX rising.
Finally, ADX crosses 50 and the ADX line turns red. ADX > 50 is an area that we determine to be extreme. In an extremely strong trend, ADX can reach into the 60's or 70's and beyond, but those instances are rare. We've found that ADX > 50 is a good place to take profits or really tighten up trailing stops if we are in a trade. If we are not in a trade, ADX > 50 is not an area that we would want to enter a new trade.
Once the ADX line rolls over, no matter where this occurs, the ADX doesn't provide any trading signals on decreasing strength.
Disadvantage of ADX
The biggest problem with ADX is that it is a lagging indicator. It tells you when the trend is strong, not when the trend starts. ADX is not an indicator to be used for finding tops and bottoms in the market.
Conclusion
ADX is one of our favorite indicators at Simplexity Analytics. It can be used for trend following strategies and well as mean reversion strategies.


