


Simplexity Seasonals
All markets have seasonal tendencies. Year after year, we see markets often top and bottom around the same time every year. For example, here is a gold chart with the seasonal indicator at the bottom. You can see how gold usually bottoms towards the end of the year and then has a strong rally until Spring. Then it slumps until mid Summer before rallying again. Buying gold at Christmas has been a very strong trade and the chart below demonstrates why.

Crude Oil is similar. Oil often bottoms in the cooler months and as demand picks up in the warmer months, prices follow.

A seasonal indicator is one way to look at seasonal bullish and bearish areas. Another way is to try to quantify that blue seasonal indicator into actual numbers.
The chart below is based on buying gold in each month of the year. If you were to buy gold on the 1st of every month and sell it on the last day of the month, how would that turn out? See below.

Just as the seasonal indicator suggests, buying at the end of the year and into January is very strong. As well, notice the mid summer bottom from June-August.
Let's take this a step further. Let's see how gold does when buying each of the 52 weeks of the year.

The best week of the year in terms of net profit is week #52. Also, notice all the profitable weeks from week #30 - #35. These weeks would fall around July-August. These keep us in line with our previous tests.
*Of note --- Since the days and dates change every year on our calendar, these weeks are based on the first Monday of the year being week #1. Since the first trading day of the year changes year to year, this is not an exact science. We are just looking for general areas of strength and weakness.
Now let's look at each day of the year. With a 365 day calendar, once we take out all the weekends and non-trading days such as holidays, most years have about 250 'trading days'.
Let's start looking for actual trades. Here are the parameters for the trades:
We will buy gold on the open of each 'trading day' of the year. We will set a stop loss of $2,000, meaning if the price moves against us then we will exit when a $2,000 loss is hit. We will exit the trade on the profitable side when we get our first close that is showing a profit. Once we get this confirmation, we will sell at the next days open.
Below are the top 15 trading days of the year for gold.
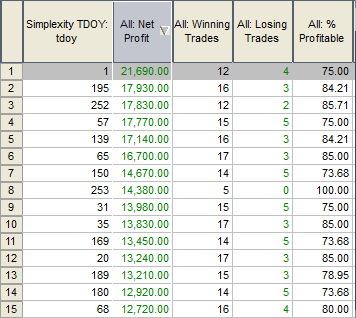
No surprise, the first trading day of the year is the best. Also, notice some end of year days (#252, #253) and beginning of year days (#31, #35, #20).
This is some nice historical data to help reinforce our seasonal bias. However, how can we make this better? How can we better protect ourselves from the possibility of these days being merely coincidental? The best answer to that would be to find 'clusters' of these days grouped together and not just single days on their own.
Simplexity Analytics searches for these trading days using 5 different algorithms.
1-Date of the year. How the trade fared on this particular date of the year historically.
2-TDOM. Trading day of the month. How the trade fared on this particular trading day of the month.
3-TDLM. Trading day left in the month. How this trade fared on this particular trading day of the month COUNTING BACKWARDS using the last trading day of the month as TDLM #1.
4-TDOY. Trading day of the year. How the trade fared on this particular trading day of the year.
5-Holidays. How this trade fared on the 10 days before and after a holiday or other important annual event.
Here is how this looks on our calendar for gold:
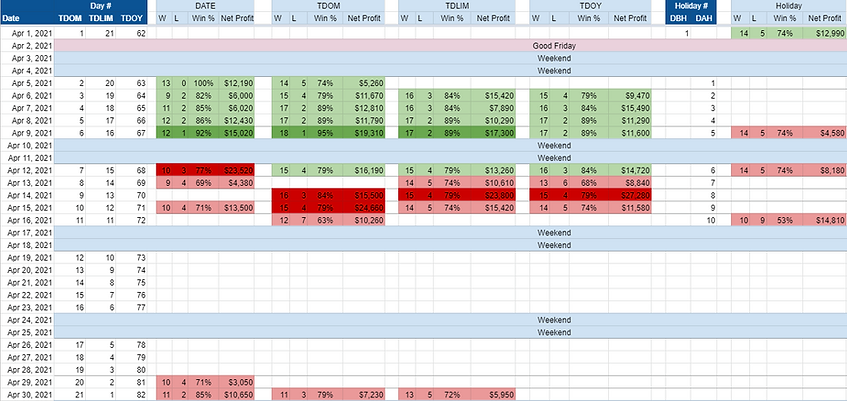
Column 1 is the calendar date.
Column 2 is the TDOM (trading day of the month) number.
Column 3 is the TDLM (trading day left in the month) number.
Column 4 is the TDOY (trading day of the year) number.
Column 5 lists any good buy trades in green and sell (short) trades in red for the calendar date.
Column 6 lists any good buy trades in green and sell (short) trades in red for the TDOM.
Column 7 lists any good buy trades in green and sell (short) trades in red for the TDLM.
Column 8 lists any good buy trades in green and sell (short) trades in red for the TDOY.
Column 9 is DBH (days before holiday).
Column 10 is DAH (days after holiday).
Column 11 lists any good buy trades in green and sell (short) trades in red for the 10 days prior to or following a holiday.
By charting each of these days on a calendar like this, we can start to see these clusters of days grouping together horizontally. Darker green and darker red days showcase the strongest trades in each vertical grouping.
Looking at the April gold calendar, you can clearly see the first week of April as a very strong week historically and the following week is very bearish historically. Also, note the few bearish days at the end of the month. There are only a few days here and they don't stretch across all the columns. Although these days have been historically bearish, they are much less so than week #2.